Manheim Used Car Index Chart
Short answer
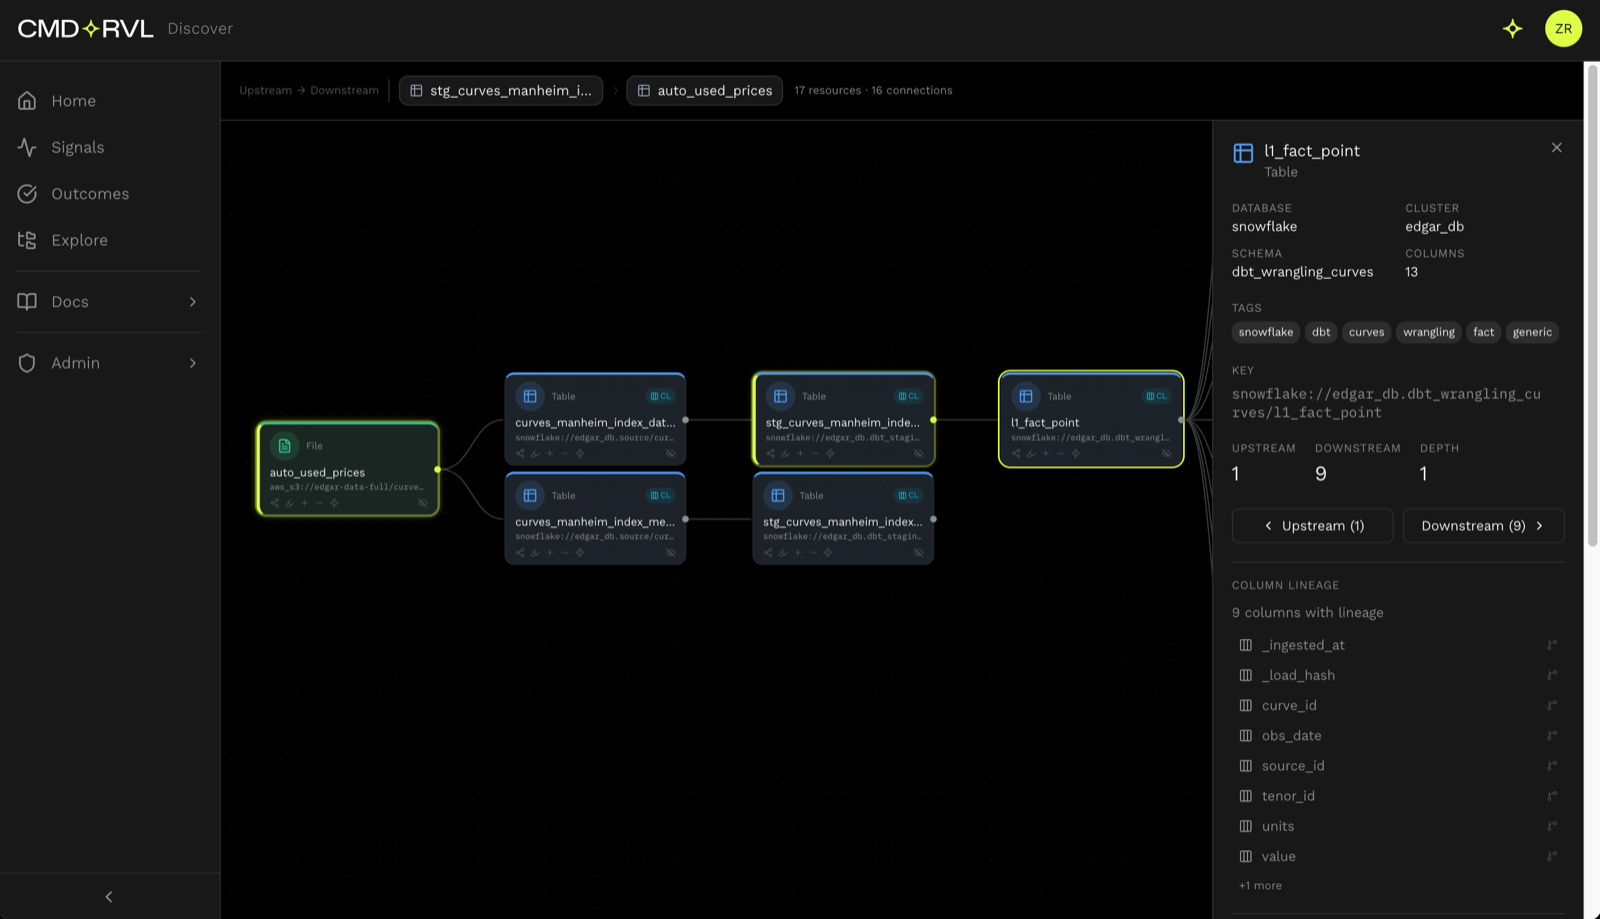
CMD+RVL tracks Cox Automotive's public Manheim Used Vehicle Value Index with monthly and mid-month readings, source lineage, and context for CPI and auto-credit analysis.
Understanding the Manheim Used Vehicle Value Index
What is the Manheim Index?
The Manheim Used Vehicle Value Index is a monthly measure of US wholesale used-vehicle prices. Because it reflects real auction transactions rather than listing prices, it is widely used as a market barometer for wholesale auto conditions.How is the index calculated?
Cox Automotive applies a hedonic model so each monthly value controls for changes in the mix of vehicles sold. The adjustment helps distinguish true price movement from changes in make, model, age, mileage, or condition.Why does it matter?
Wholesale used-car prices feed into retail prices, auto lending, lease residuals, dealer profitability, and inflation forecasting. Analysts often watch the Manheim index before used cars and trucks CPI reacts.How to use this page
Read the latest index value alongside month-over-month, year-over-year, and range metrics. Then use the lineage and source panels to inspect exactly which catalog curve, table, provider, and channel produced the page-pack data.Frequently asked questions
Where can I find the Manheim Used Vehicle Value Index for free?
Cox Automotive publishes public monthly Manheim index releases. CMD+RVL tracks the public monthly and mid-month values in a free page-pack, while subscriber-only daily data remains outside the public dataset.How often is the Manheim Index updated?
The official monthly index is usually released mid-month for the prior month's data. A preliminary mid-month read may appear before the full-month value is finalized.What does a Manheim Index value of 200 mean?
The index is benchmarked to January 1997 = 100. A value near 200 means hedonic-adjusted wholesale used-vehicle prices are roughly double the base-period level.Is the Manheim Index seasonally adjusted?
The standard headline series is seasonally adjusted so analysts can compare periods without normal auction-seasonality dominating the signal.How does the Manheim Index relate to CPI used-car prices?
The index is a leading wholesale signal for the Bureau of Labor Statistics used cars and trucks CPI component. Retail prices can follow with a lag and may not move one-for-one.What caused the 2021-2022 spike?
Semiconductor shortages, constrained new-vehicle production, strong consumer demand, and tight used-vehicle supply pushed wholesale prices sharply higher. Prices later normalized but remained important for inflation and residual-value analysis.Related data pages
What you’re looking at
This page is a working outcome.
Everything above, including the live figure, lineage trail, and automatic refresh, is a working example of an Operated Monitor, one of the outcomes CMD+RVL runs for clients. We stand up the same against the numbers your decisions depend on:
Pulled from source
Connected straight to where your data lives, with lineage captured on every value so each number traces back to where it came from.
Always current
Refreshed on a schedule and monitored, so the figure you cite is the figure that is true today, not last quarter’s spreadsheet.
Defensible
A standing record of what each number was and when, with the evidence to prove what you knew and when you knew it.